Refine your bot
Teneo offers you extensive possibilities to test and debug your solution before going live with changes and additions. The Tryout panels on the right in the main solution view work and are for debugging your bot. Tryout also has its own advanced window which can be accessed by selecting the 'Tryout' button located in the 'Solution' section of the main solution view and includes the following views:
- Tryout: this is the chat panel where you simulate user inputs and see the bot response.
- Input: shows how the word was tokenized and its annotations including the relevant processing changes.
- Add Parameter: this is the panel where you simulate input parameters to your bot.
- Path: shows the exact path the user took to receive the current output.
- Output: this is where the user can view output details for the transaction.
- State: view the current variable values and engine state.
- Messages: view messages received during this session - between transactions.
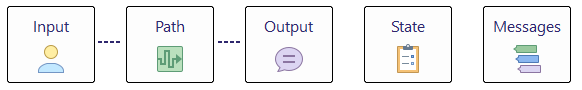
You can open these panels via mouseclick as follows:
Before using Tryout be sure you:
- Save the relevant flow or items you were working on (press Save All in the Solution window to be on the safe side).
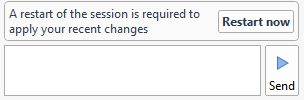
- If Tryout shows a Restart now or Reload now notification, press the given button.
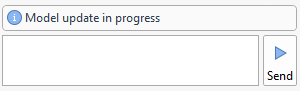
- If Tryout shows model training started wait for it to show model training completed.
- Be sure you are testing with the right input.
Tryout Panel
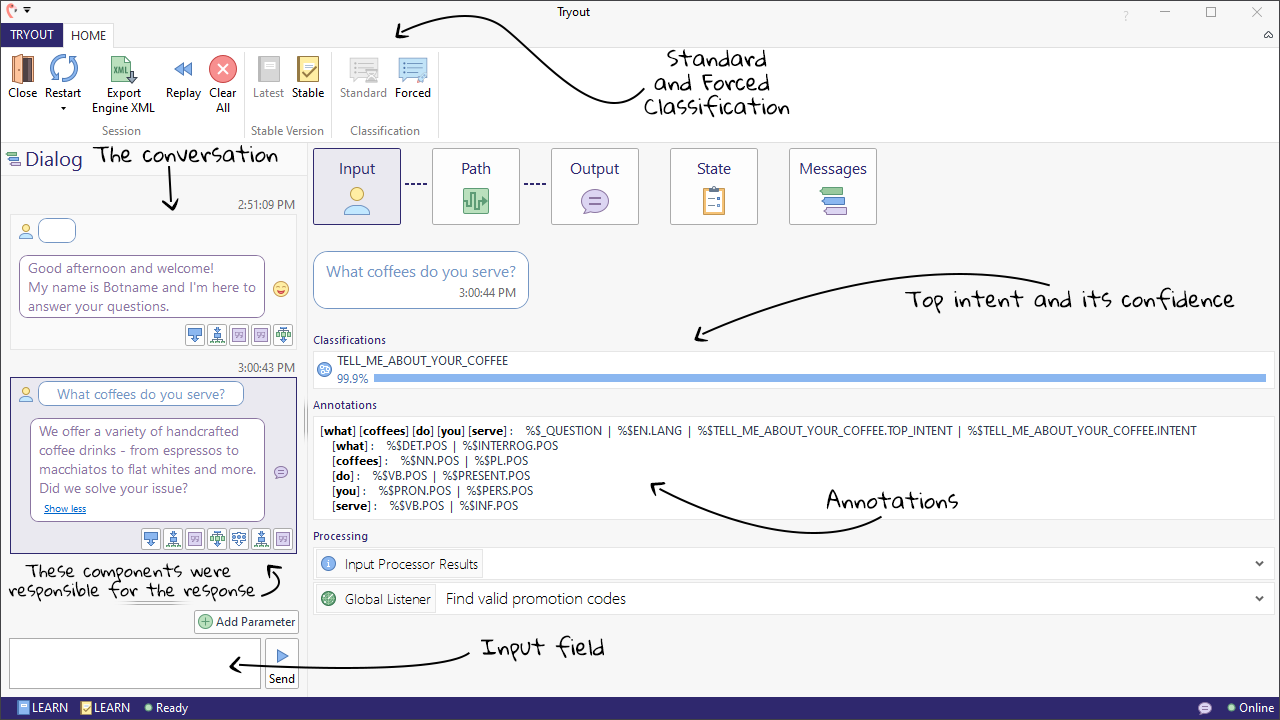
Tryout is the most important panel when testing your solution. It is where you enter the inputs you want to test and see the response that is returned. From here you can also navigate via mouseclick directly into the trigger, flow, output, and any other components involved with the answer that was given. You can mouse over the icons associated with the response until you find the right component to examine further. Take a closer look at Tryout to acquaint yourself with the various panels:
Let's zoom in on the icons shown under the bot response. Here we notice the following sequence of events: flow triggered -> flow raised -> output given -> flow dropped:
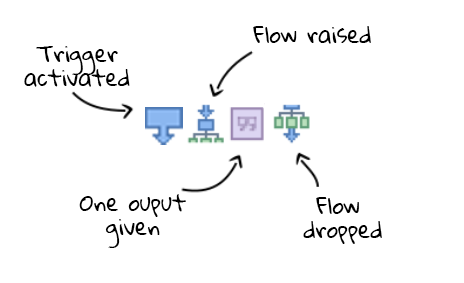
If you mouse over one of the icons you see a preview of the element, and can also click your way directly into the flow at that location.
In this video we test an input, notice a typo in the output, then jump from Tryout to the the flow to make the correction, and finally test what we've done:
Some Tryout tips:
- To open a flow in edit mode via Tryout, use alt+mouseclick.
- To re-try a user input you already entered, select it with the mouse and it will appear automatically in the input field.
- If the Tryout panel becomes cluttered you can clear out old content via the option Clear All from the context menu (right mousekey).
Restart / reload
As the name suggests, clicking the 'Restart' button will restart the session, i.e. active flows are ended and the flow stack is cleared. If you have made changes to a flow, these will become active by clicking 'Restart'.
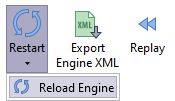
When clicking on the little black triangle next to 'Restart', you can open a drop down where the option 'Reload Engine' can be selected. In contrast to 'Restart' which only ends active flows , 'Reload Engine' will reload the entire solution. This includes ending all active flows, but also re-setting global variables and scripted contexts.
Sometimes Teneo detects that an engine reload is necessary, for example, when you added or modified global variables, scripts, listeners or the trigger ordering. In that case the option will be made directly available to you:
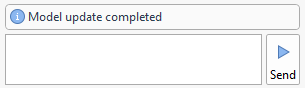
If you happen to see the message Model update in progress above the restart button you should wait for Model update completed to appear before actually testing. This assures that the current training data (including all modifications you might have made) are taken into account when trying inputs. It will look like this:
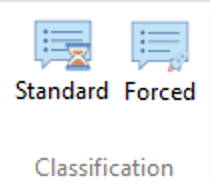
Standard or Forced Classification
The Standard classification mode makes use of the deferred intent classification approach where Predict annotations are only created if - during the matching process - references to class annotations are detected.
The Forced classification mode re-creates the behavior of earlier versions of Teneo, where class annotations are created for all tested inputs independently of whether these annotations were later used during the matching process or not.
Finding a flagged error
Script errors during processing, missing language object references or stuck flow warnings appear as visual notifications in the Tryout panel. The full information can then be found in the Tryout advanced windows Messages. To demonstrate this, we've taken a flow User wants bot suggest a coffee and built in some design flaws, as well as a faulty flow listener and bad script commands. This is what happens when we try to invoke the flow in Tryout:
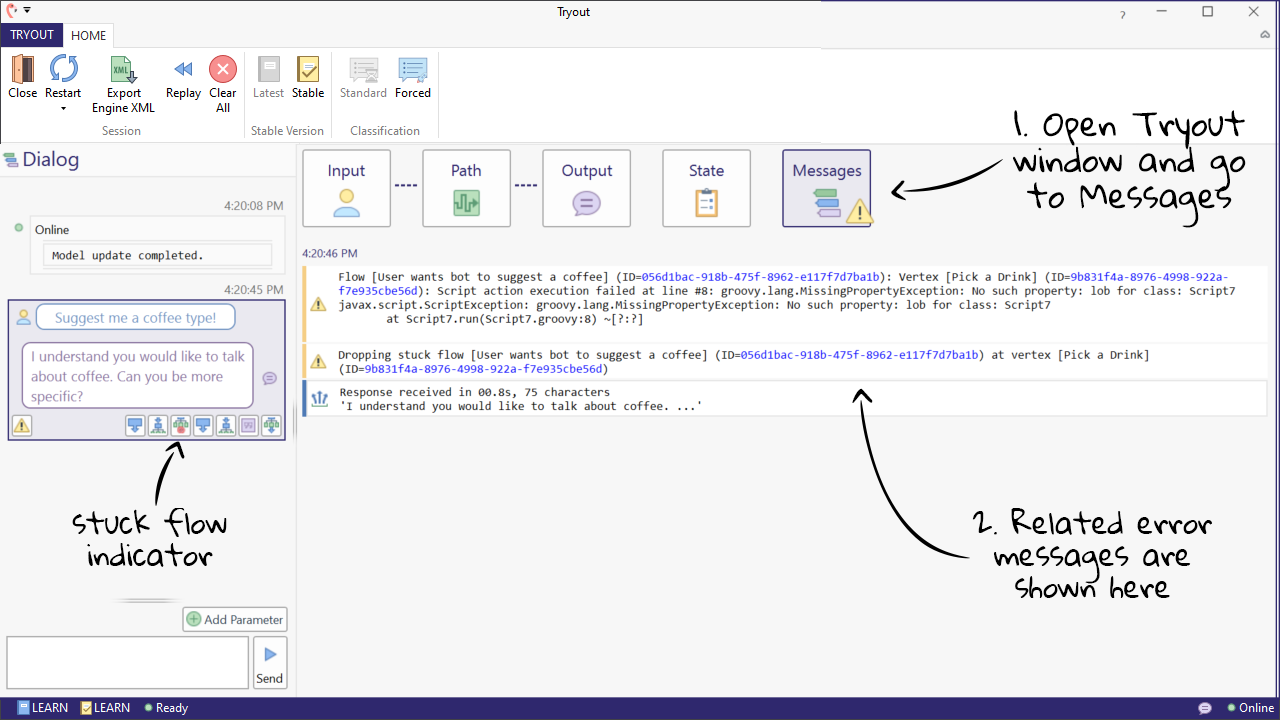
Tryout Advanced
This window shows all information associated with a specific transaction, including a complete trace of global and flow variables as well as results of listeners, and other solution elements. It is also the place where you see warnings/error messages that occurred during the transaction. The information is divided into several sections which can be expanded or collapsed, as needed:
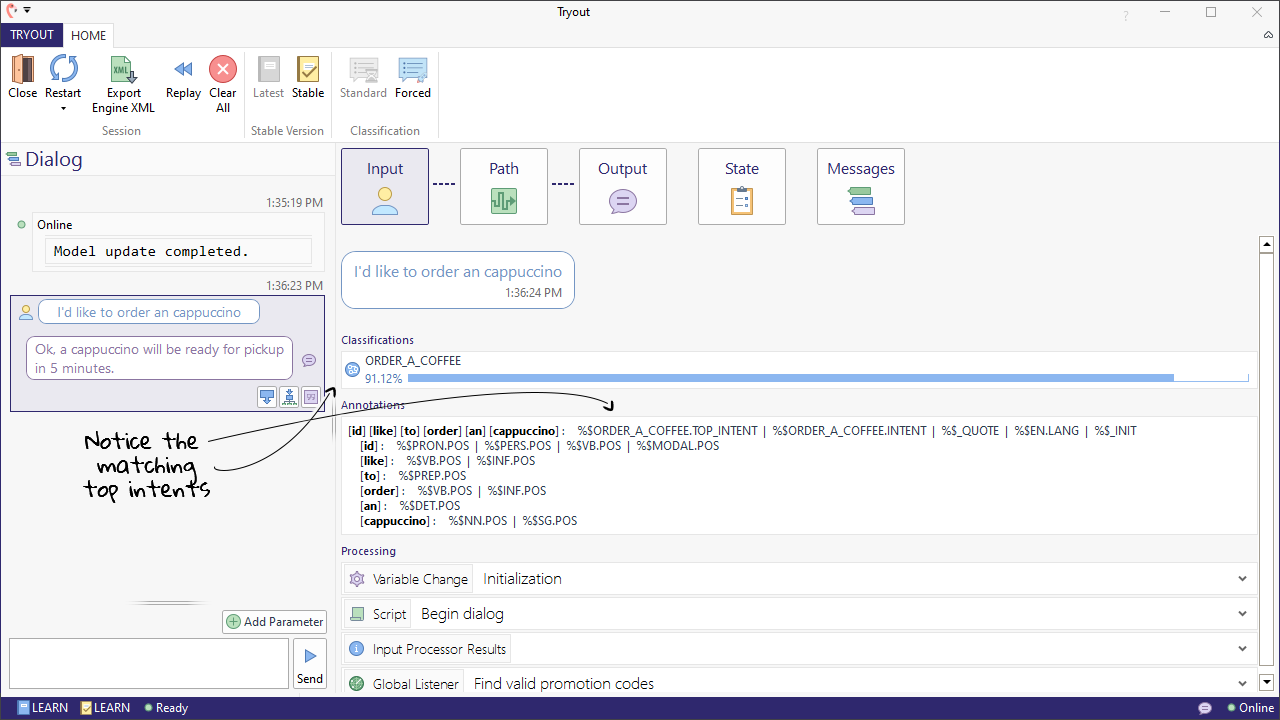
Input and Intent Classification
The section called Input shows the top intent along with its confidence level. It will optionally show up to four other intents with somewhat nearby confidence levels. This is useful for learning which class triggers in your solution are most likely to be relevant to a certain input.
In this example, we show an input that correctly runs into the safety net. In the Intent section you see the two intents that were annotated with the highest confidence levels. If your input is supposed to go to one of those triggers with Class Match Requirement, you could click into the item directly and add additional training data to make it work better.
The Input Summary section shows the results of the Input Processor: which language was detected, which parts of speech, which named entities as well as the top intent. It is also the place where you can discover that typos in the original input were corrected. In this particular example, we can see that the language English was detected, and a couple of POS tags were assigned to each word. For additional information about confidence levels and how typos were corrected you should check the detailed Input Processor result in the Processing Path.
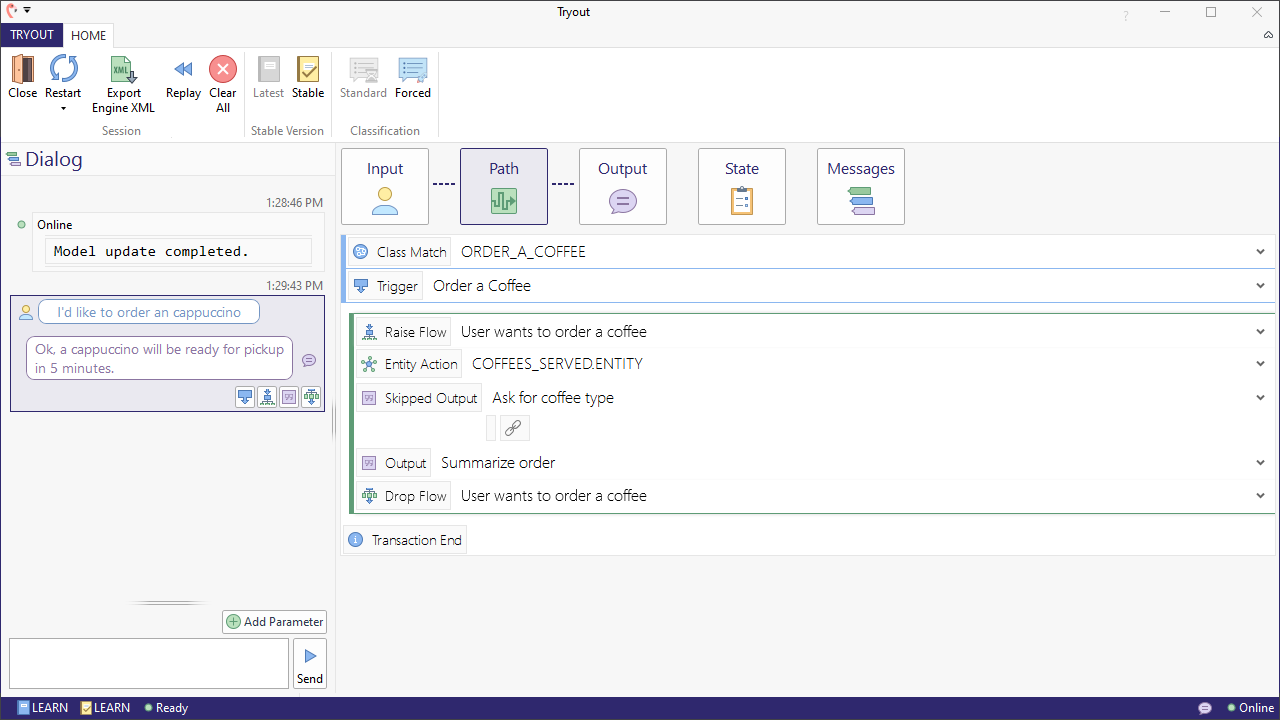
Path
In Path we can see the flows, triggers, and outputs behind the response that was given. In our example, we can see that the class trigger Can I order a Cappuccino in the flow User wants to order a coffee was activated. The empty entry for ''(Prompt for coffee type) means that this prompt was skipped (a skip condition) as we already had that information. We also see that the output given was a prompt for the size.
The section for 'Path' in 'Tryout' can be quite long, but it is also the most important in finding out exact details about the transaction. It shows you exactly the steps taken from the time the user hits enter to the point where the bot returns its response. This includes:
- Global or flow scripts that ran and the variables they changed.
- Input processor results, including topintent, and which words were spell-corrected.
- Global and flow listeners that triggered and the variables they changed.
- Which trigger responded to the input.
- Used words (if a syntax condition was involved)
- Outputs that were skipped.
- Outputs used to construct the answer.
- Flows that were raised, paused or dropped.
- Any errors or warnings received.
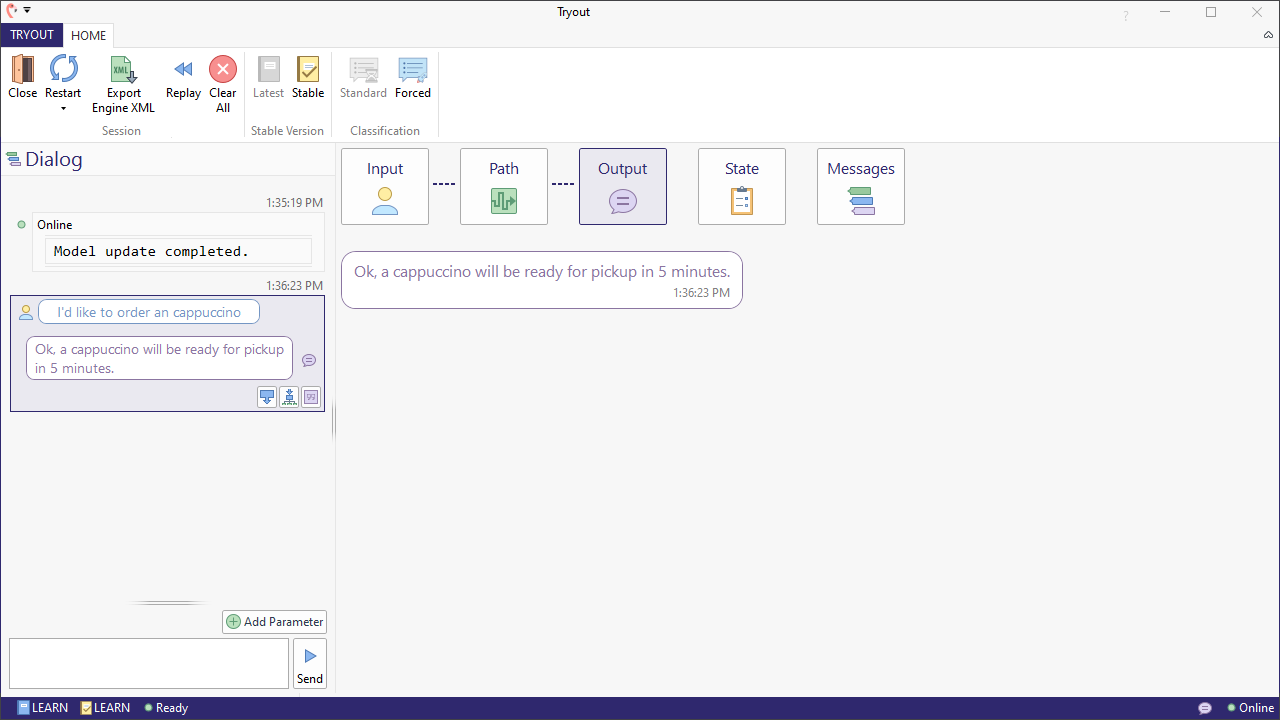
Output
This section shows the following output that was sent by the bot.
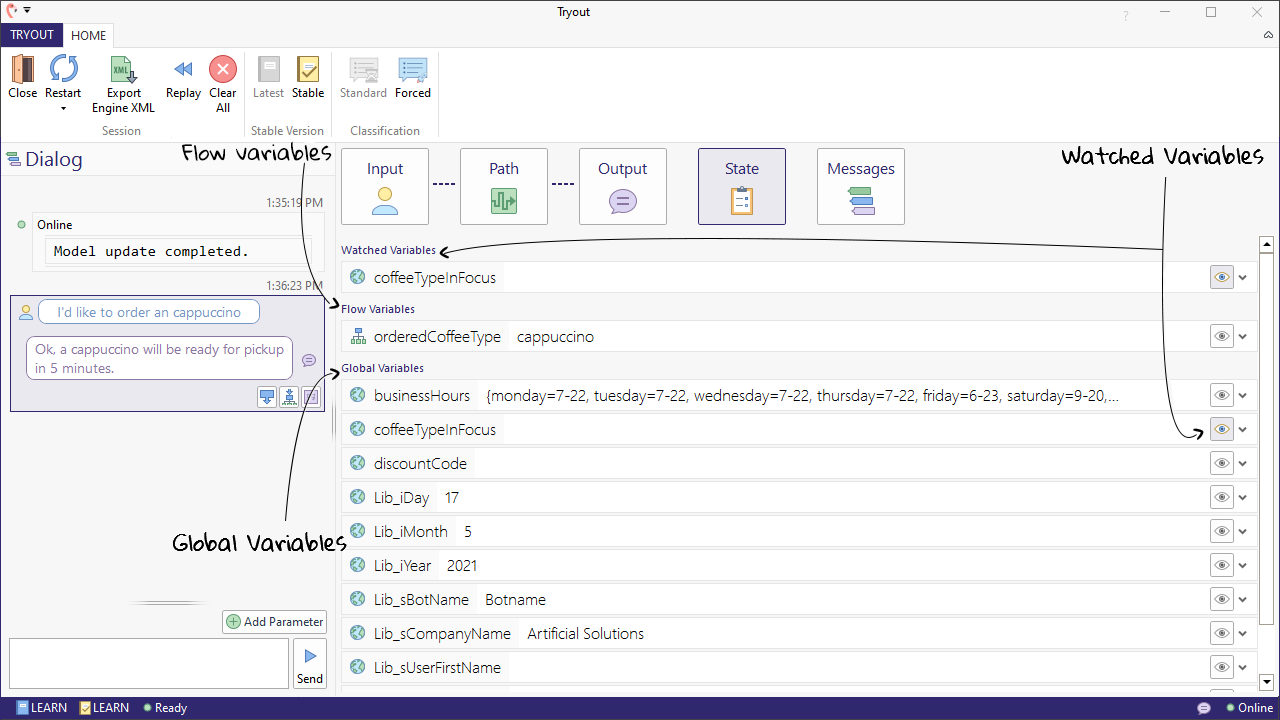
State
These sections for variables work together. In Global Variables you see a complete list of global variables defined in the solution along with their values following completion of the transaction. Since this list can be rather long, Teneo offers a way to track specific variables, making it much easier for you to find them. If you wish to follow a global variable click the eye icon next to the variable name in the Global Variables section. The variables you selected are then displayed separately in the Watched Variables part of the section. If no variables are currently followed, the Watched Variables section is not shown. Note that you can watch flow variables here as well.
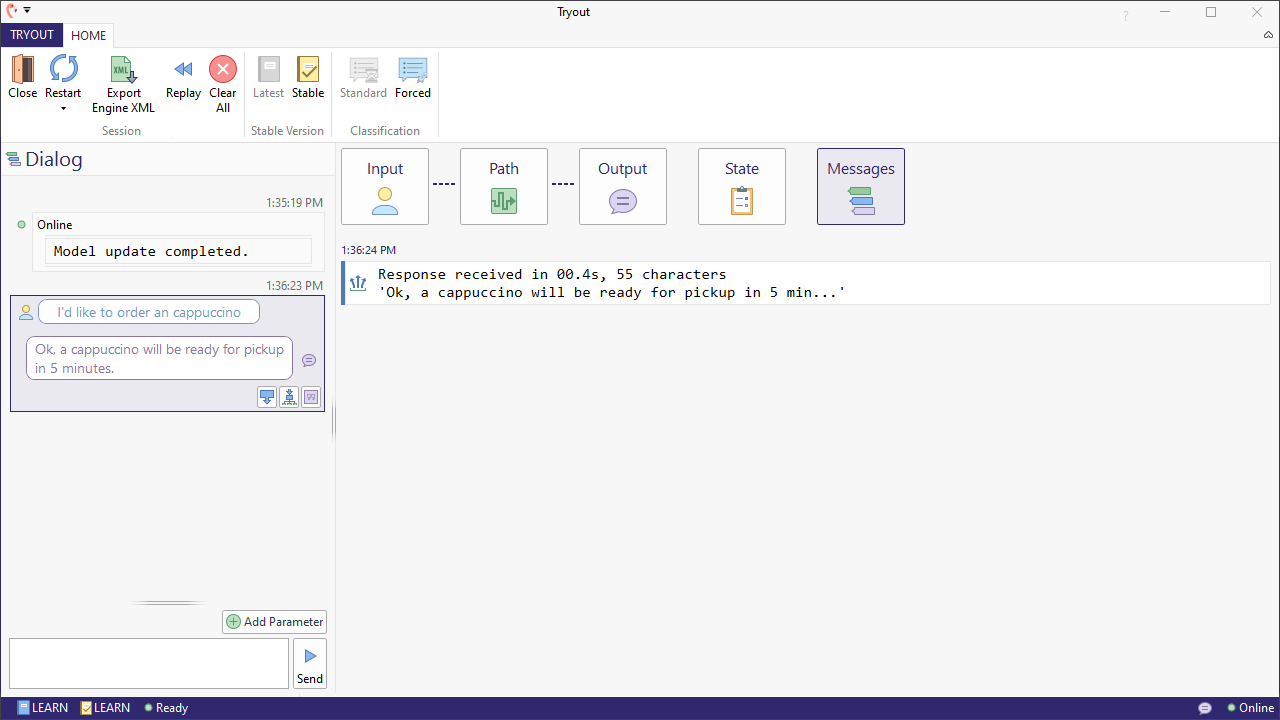
Messages
The Messages panel gives you details about the entire session. It repeats error and warning information seen during individual transactions but also offers you a helpful option for debugging your solution script. If you include println() calls at script locations, their output will be logged in the Output section.
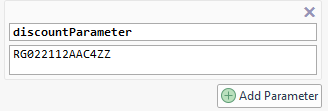
Inputs Panel
The Inputs panel allows you to simulate sending parameters to your bot, which is useful if you want to simulate external context that you do not have available in Tryout. All parameters are considered to be of type 'string'. To add a parameter, fill out the name and the value. These will be sent to Teneo for that active transaction. If the values should change during the course of the conversation you can do that here too. The page How to store input parameters shows an example working with input parameters.